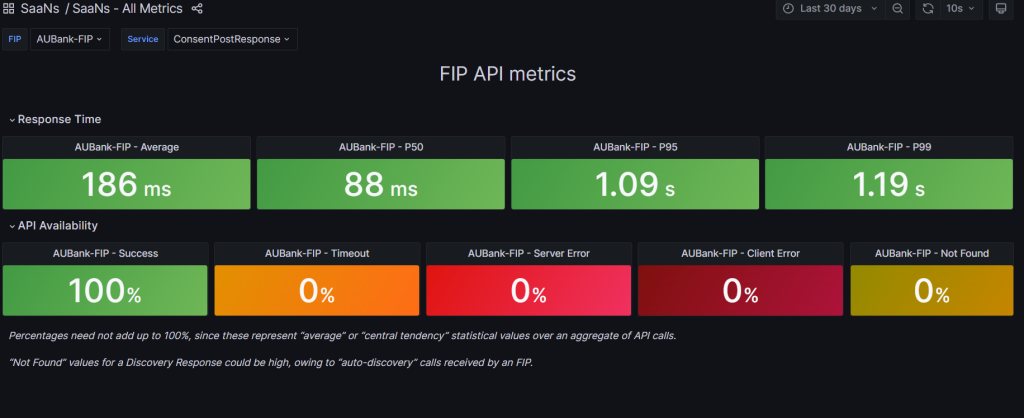
This provides the health of responses of each of the following APIs provided by a selected FIP:
- Discovery
- Linking
- Confirm Linking
- Consent Post
- FI Request
- FI Fetch
- Unlinking
For each of these APIs, the “Health” of the API response is measured in terms of:
- Availability of the API’s response
- Latency (or Response Time) of the API’s response
These health measures can be derived for any specified duration, e.g “Past 1 hour”, “Last 2 days”, “Last 30 days” and the like.
The “Availability” of each API is measured in terms of:
a. Success percentage – the percentage of API requests that returned a successful response. (identified through a 200 http response code)
b. Timeout percentage – the percentage of API requests that failed owing to a timeout (“timeout” defined as the AA NOT receiving a response within 30 seconds of the API being called)
c. “Server error” percentage – the percentage of all API requests that failed owing to some error in the server (typically identified through a 5XX http response code)
d. “Not Found” percentage – the percentage of all API requests that failed because the “resource” sought could not be found (typically identified through a 404 http response code)
e. “Client error” percentage – the percentage of all API requests that failed because there was an error in the request itself (typically identified through any other 4XX response code)
While these will add up to 100% when measured by each AA, the statistical measure applied by Saans across all such percentages reported individually by each AA, may result in them not necessarily adding up to 100%.
(Read more on Saans’ statistical measures below, for details.)
The “response time” of each API is measured in terms of:
a. Average latency – an average of the response times (measured in milliseconds) measured for each response received
b. P50 latency – the minimum response time measured over 50% of the responses received: this represents the “central tendency” of the API’s latency
c. P95 latency – the maximum response time measured over 95% of the responses received
d. P99 latency – the maximum response time measured over 99% of the responses received
The P95, P99 latencies give an idea of the “worst-case” behaviour exhibited by the API.
What are the statistical measures plotted by Saans for each of the above health APIs?
The purpose of the Sahamati service is to provide a view into the “central tendency” of each API’s health measure, as indicated by all the health signals collected.
A P50 statistical measure is applied by Saans to each of the above metrics collected.
Thus, for a particular FIP, the Saans metrics shown should be read as (as an example):
Availability Metrics (over the last 24 hours)
“Success percentage of 65.7%” – this indicates that the central tendency of the FIP’s success percentage experienced by all API requesters, over last 24 hours, is 65.7%.
This is the most accurate (albeit approximate as statistical measures go) representation of the FIP’s API availability.
Similarly, such central tendency metrics are derived for each of the other Availability Metrics.
A consequence of this is: the statistical, central-tendency, percentages measuring availability of each FIP may not add up to 100% exactly.
Response-time metrics (over the last 24 hours)
“Average latency of 240 ms” – this indicates that the central tendency of the average latencies experienced by API requesters is 240 ms.
“P99 latency of 450 ms” – this indicates that the central tendency of the “maximum” latency experienced by API requesters is 450 ms.