The “Data Notification” function is invoked when an FIP receives a data request from an AA, triggered on the basis of consent provided to an FIU via the AA. This function involves the FIP preparing the data, as sought in the request, and then notifying the AA once the data is prepared for the AA to fetch.
- If this function works properly, two outcomes are expected:
- The AA should receive a notification within a reasonable period, after the FIP receives the data request. Usually, this should be no later than a few minutes, at worst.
- The FIP’s notification should indicate that the status of Financial Information (FI) is “Ready”.
- If either of the two outcomes do not happen, that indicates the function is not healthy.
Therefore, the two metrics that are measured and plotted in the dashboard:
- a. Missed notifications, i.e. the % of data requests for which the FIP never sent a notification, in reasonable time. This is measured once a day, at midnight, by the AAs for each FIP.
- b. Failed notifications, i.e. the % of data requests for which the FIP sent a notification indicating FI is NOT ready. This could either be owing to internal timeouts or business declines at the FIP’s end. This is measured in real-time, every 10 min, by the AAs for each FIP. The 10-min summaries are then plotted in SaaNS.
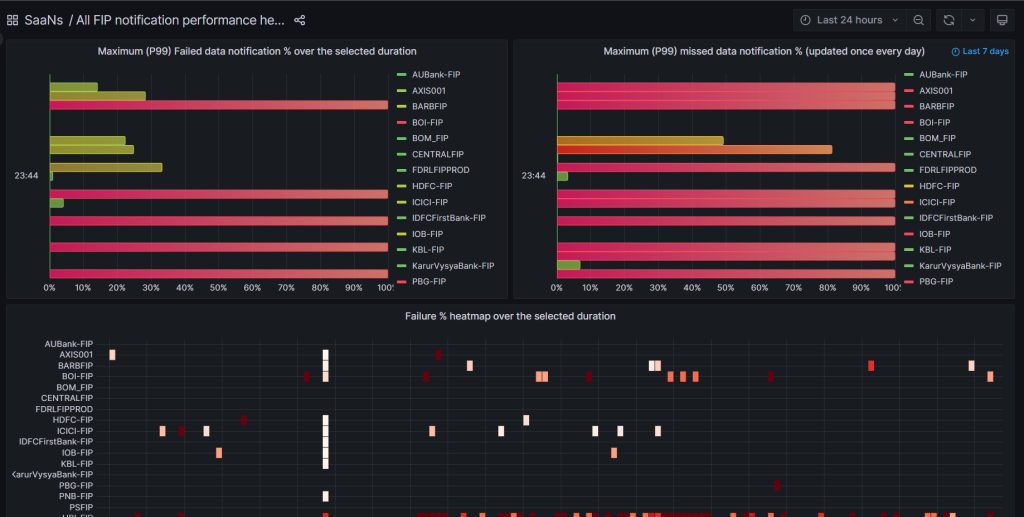
For the above metrics, the following visualizations are provided:
For Missed Notification % – for each FIP
- A heatmap of the percentages over the last 7 days – this helps determine the “consistent pattern” of behaviour of an FIP, over time, plotting the daily value over 7 days
- A 99th percentile value of the percentages over a selected duration (e.g. 24 hours, 2 days, etc.) – this helps determine “how bad” the health has been, by looking at the worst (barring any one-off outliers) daily value recorded, over the selected duration. Thus, an FIP that shows a 99th percentile value of 15% is significantly better than one that shows a 99th percentile value of 85%.
For Failed Notification % – for each FIP
- A heatmap of the percentages over a selected duration – this helps determine the “consistent pattern” of behaviour of an FIP, over time, plotting the 10-minute summary values collected by AAs connected to that FIP
- A 99th percentile value of the percentages over a selected duration (e.g. 1 hour, 24 hours, 2 days, etc.) – this helps determine “how bad” the health has been, by looking at the worst (barring any one-off outliers) 10-minute summary value recorded, over the selected duration.